Summary
This step-by-step guide outlines a method for clustering keywords using Google Sheets and ChatGPT, specifically for analyzing keyword traffic for Walmart in the US. The process includes several key steps:
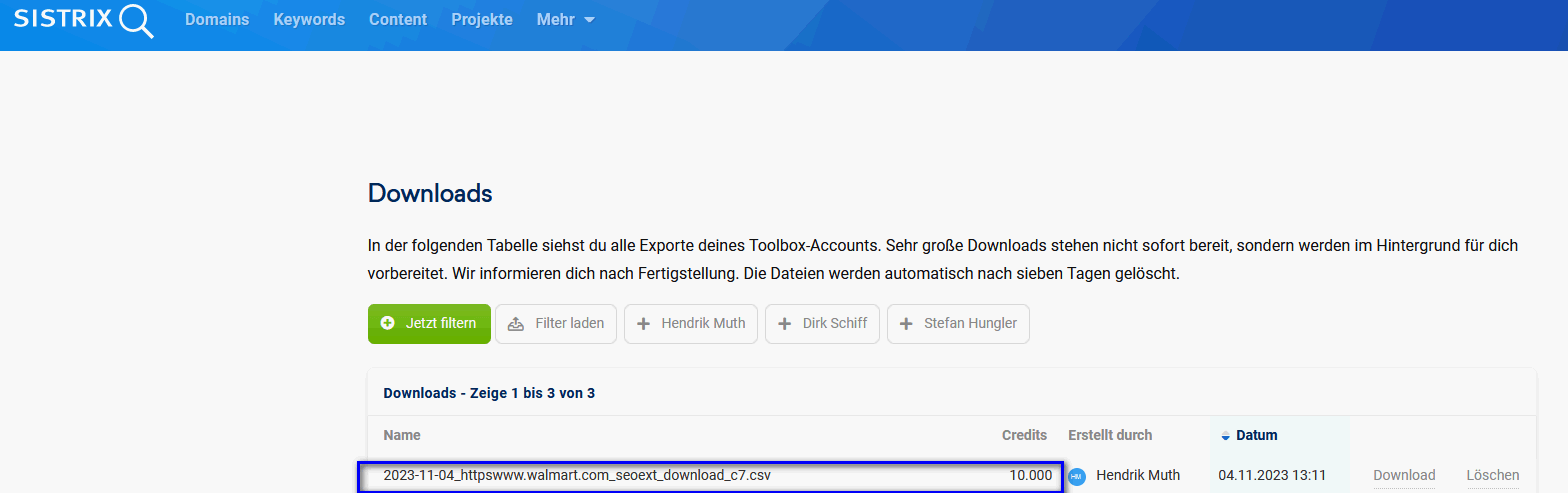
Data collection: 10,000 keywords that drive traffic to Walmart in the US were downloaded using Sistrix, a German SEO tool.
Keyword clustering using ChatGPT: The next step was to use ChatGPT to create initial keyword clusters for Walmart's US listings. Initially, 15 clusters were created, with 5 more added later.
Category specific keywords: For each category, such as "Electronics & Gadgets," specific related keywords were generated using prompts in ChatGPT.
Script integration with Google Sheets: A custom script was written to automate the keyword categorization process in a Google Sheet. This script
Determines the range of keywords in the sheet.
Defines categories with corresponding keywords.
Uses the Jaccard similarity calculation to match keywords to the most similar category.
Assigns categories to each keyword and writes the results to the spreadsheet.
Mining the results with another script: A separate script was used to evaluate the results by aggregating clicks per category and creating a graph for visualization. This process involved:
Reading data from specific columns for categories and clicks.
Summing clicks per category
Creating a new sheet for the aggregated data and visualizing it with a column chart.
Analyzing the keyword clustering results: The final analysis showed "Unknown" as a significant category, indicating keywords that couldn't be categorized. Further analysis and manual adjustments were made to reduce the number of unknowns and refine the categorization.
This method provides an efficient way to categorize a large number of keywords and provides insight into popular search terms and categories for a specific retailer such as Walmart.
Keyword clustering with ChatGPT and Google AppsScript
Every once in a while, you are faced with the problem of clustering a large number of keywords, for example in the course of a competitive analysis. In the past this was mostly done manually, but with ChatGPT and other modern technologies it is much easier to implement.
In the following, I would like to show you a way and provide a script for Google AppsScript, i.e. Google Sheets, that makes keyword clustering much easier.
Example of a large-scale cluster of keywords from Walmart
The following is a step-by-step guide:
As a first step, I downloaded 10,000 keywords that bring Walmart the most traffic in the US, according to Sistrix, a popular German SEO tool.
The next step was to switch to ChatGPT4 and enter the following prompt: "Create 15 keyword clusters for the offer of Walmart in the us". I ended up adding 5 more when I was done looking at the keywords.
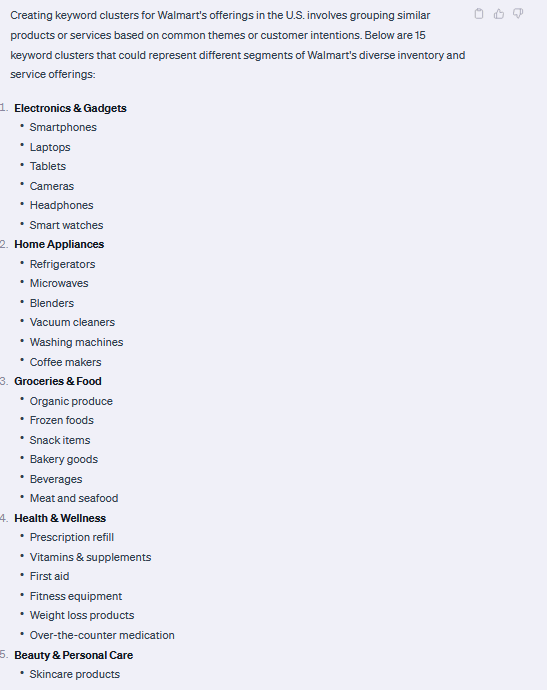
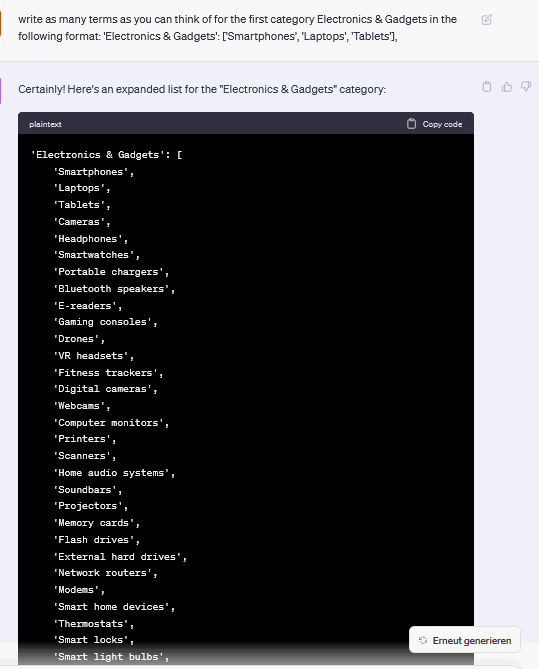
After ChatGPT was finished, I entered the following prompt: write as many terms as you can think of for the first category Electronics & Gadgets in the following format: 'Electronics & Gadgets': ['Smartphones', 'Laptops', 'Tablets']
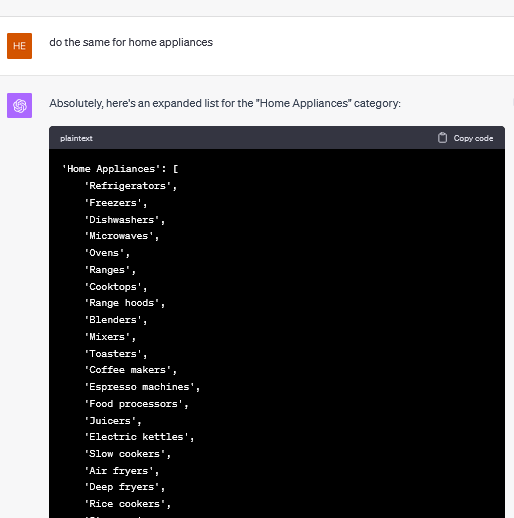
In the next step, I repeated this for all categories like the first one. However, I was able to use the prompt: do the same for "Example Category"
After adding five more categories, including erotica, alcohol and consoles and computer games ^^, one of the main search terms for Walmart US was "dildo", I integrated the categories into the following script I created.
function clusterKeywords() {
var sheet = SpreadsheetApp.getActiveSpreadsheet().getActiveSheet();
var lastRow = sheet.getLastRow(); // Find the last row with content
var keywordsRange = sheet.getRange("A2:A" + lastRow); // Start from A2 to the last row with content
var keywordsValues = keywordsRange.getValues();
var categories = {
'Electronics & Gadgets': [
// ... list of corrected and properly capitalized keywords
],
'Home Appliances': [
// ... list of keywords
],
// ... more categories if needed
'Health & Wellness': [
// ... list of keywords
]
};
// Calculate the Jaccard Similarity between two sets
function calculateJaccardSimilarity(str1, str2) {
str1 = String(str1).toLowerCase();
str2 = String(str2).toLowerCase();
let set1 = new Set(str1.split(' '));
let set2 = new Set(str2.split(' '));
let intersection = new Set([...set1].filter(x => set2.has(x)));
let union = new Set([...set1, ...set2]);
return intersection.size / union.size;
}
// Find the best matching category for a given keyword
function findBestCategory(keyword, categories) {
let bestCategory = 'Unknown';
let highestSimilarity = 0;
let similarityThreshold = 0.1; // Consider adjusting the threshold based on your needs
Object.keys(categories).forEach(function(category) {
categories[category].forEach(function(categoryKeyword) {
let similarity = calculateJaccardSimilarity(keyword, categoryKeyword);
if (similarity > highestSimilarity && similarity >= similarityThreshold) {
highestSimilarity = similarity;
bestCategory = category;
}
});
});
return bestCategory;
}
// Array to store the categories for each keyword
var categoryAssignments = [];
keywordsValues.forEach(function(row) {
var keyword = row[0];
if (keyword) {
var category = findBestCategory(keyword, categories);
categoryAssignments.push([category]);
} else {
// If no keyword is present, assign "Unknown"
categoryAssignments.push(["Unknown"]);
}
});
// Write the results to column F, starting at row 2
var startRow = 2;
var startColumn = 6; // Column F is the 6th column
var numRow = categoryAssignments.length;
var numColumn = 1; // Only one column is being written
// Get the range in column F and set the values from categoryAssignments
var categoryRange = sheet.getRange(startRow, startColumn, numRow, numColumn);
categoryRange.setValues(categoryAssignments);
}
What does the script do?
The script automates the process of categorizing keywords by comparing them to a list of predefined category keywords, determining the best match based on Jaccard similarity, and then writing the category names next to the original keywords in the spreadsheet. These are the steps:
Get the active sheet: The script starts by getting the active sheet of the currently active spreadsheet.
Determine the range of interest: It finds the last row with content to determine the range that contains the keywords. The range starts from cell A2 (to avoid headers) and extends to the last row with content.
Read keywords: The script reads the values from the specified range, assuming they are keywords to be categorized.
Define Categories: Defines a JavaScript object called Categories that contains keys representing category names (such as 'Electronics & Gadgets', 'Home Appliances', and 'Health & Wellness') and values that are arrays of keywords associated with those categories.
Jaccard similarity calculation: The calculateJaccardSimilarity function is defined to calculate the similarity between two strings based on the Jaccard index. This is a measure of how many words are shared between two strings compared to the total number of unique words in both strings.
Category Matching: The findBestCategory function is responsible for determining the best category for a given keyword. It does this by comparing the Jaccard similarity of the keyword to each keyword in the predefined categories. If the similarity exceeds a certain threshold (in this case 0.1), the category is considered a match.
Categorization: The script iterates over each keyword extracted from the sheet, uses the findBestCategory function to find the most similar category, and stores the result in an array called categoryAssignments.
Unknown keywords: If a keyword is not present (i.e., the cell is empty), the script assigns the value "Unknown" to that entry.
Write results: After processing all of the keywords, the script writes the results back to the spreadsheet, starting with row 2 in column F. This is done by creating a range that starts at cell F2 and extends down as many rows as there are keywords. The setValues method is then used to populate this range with the category assignments.
Example of result keyword categorization for Walmart US
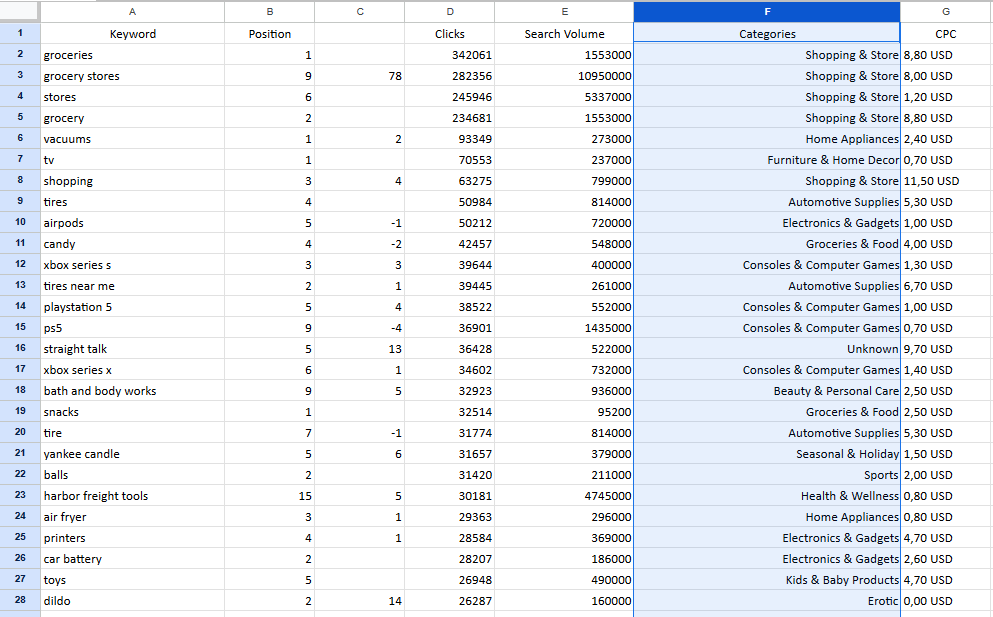
Keyword categorization evaluation for Walmart US
The next step was to evaluate the keywords. For this I used another script:
function aggregateClicksAndCreateChart() {
var sheet = SpreadsheetApp.getActiveSpreadsheet().getSheetByName('Sheet1');
// Column numbers (D for Clicks, F for Categories)
var clicksColumn = 4;
var categoryColumn = 6;
// Get the data range
var dataRange = sheet.getDataRange();
var values = dataRange.getValues();
// Create an object to store the aggregated clicks per category
var clicksPerCategory = {};
// Aggregate the clicks for each category
values.forEach(function(row, index) {
if (index === 0) return; // Skip the header row
var category = row[categoryColumn - 1];
var clicks = row[clicksColumn - 1];
if (!clicksPerCategory[category]) {
clicksPerCategory[category] = 0;
}
clicksPerCategory[category] += clicks;
});
// Create a new sheet for the aggregated data
var reportSheet = SpreadsheetApp.getActiveSpreadsheet().insertSheet('Clicks Full Report');
var report = [['Category', 'Clicks']];
// Add the aggregated data to the report
for (var category in clicksPerCategory) {
report.push([category, clicksPerCategory[category]]);
}
// Write the report data into the new sheet
var reportRange = reportSheet.getRange(1, 1, report.length, 2);
reportRange.setValues(report);
// Create a chart with the aggregated data
var chart = reportSheet.newChart()
.setChartType(Charts.ChartType.COLUMN)
.addRange(reportRange)
.setPosition(5, 1, 0, 0)
.setOption('title', 'Clicks per Category')
.setOption('hAxis', {title: 'Categories'})
.setOption('vAxis', {title: 'Clicks'})
.build();
// Insert the chart into the sheet
reportSheet.insertChart(chart);
}
// Call this function to start the process
aggregateClicksAndCreateChart();
The script first identifies and reads data from specified columns that contain categories and click counts. It then aggregates and sums the clicks by category. Once aggregated, the script creates a new sheet within the spreadsheet and records these summed click counts next to their respective categories. Finally, the script generates a column chart that visualizes the relationship between categories and their aggregated click counts, which helps to quickly analyze and visualize the data. This chart is inserted into the newly created spreadsheet for reporting purposes.
Walmart US keyword clustering result
Category | Clicks | Percentage (%) |
|---|---|---|
Unknown | 2,965,521 | 20.89 |
Shopping & Store | 1,377,661 | 9.70 |
Kids & Baby Products | 1,371,670 | 9.66 |
Groceries & Food | 1,205,839 | 8.49 |
Electronics & Gadgets | 1,035,114 | 7.29 |
Furniture & Home Decor | 1,027,341 | 7.24 |
General Merchandise & Brands | 810,365 | 5.71 |
Home Appliances | 774,369 | 5.45 |
Automotive Supplies | 581,350 | 4.09 |
Clothing & Accessories | 462,506 | 3.26 |
Consoles & Computer Games | 461,482 | 3.25 |
Health & Wellness | 413,595 | 2.91 |
Beauty & Personal Care | 319,533 | 2.25 |
Office Supplies & Stationery | 295,441 | 2.08 |
Garden & Outdoor | 274,348 | 1.93 |
Sports | 231,716 | 1.63 |
Books & Entertainment | 171,996 | 1.21 |
Seasonal & Holiday | 170,935 | 1.20 |
Erotic | 88,492 | 0.62 |
Liquor | 79,561 | 0.56 |
Pet Supplies | 78,651 | 0.55 |
As you can see, "Unknown" is still the strongest category with 20 percent.
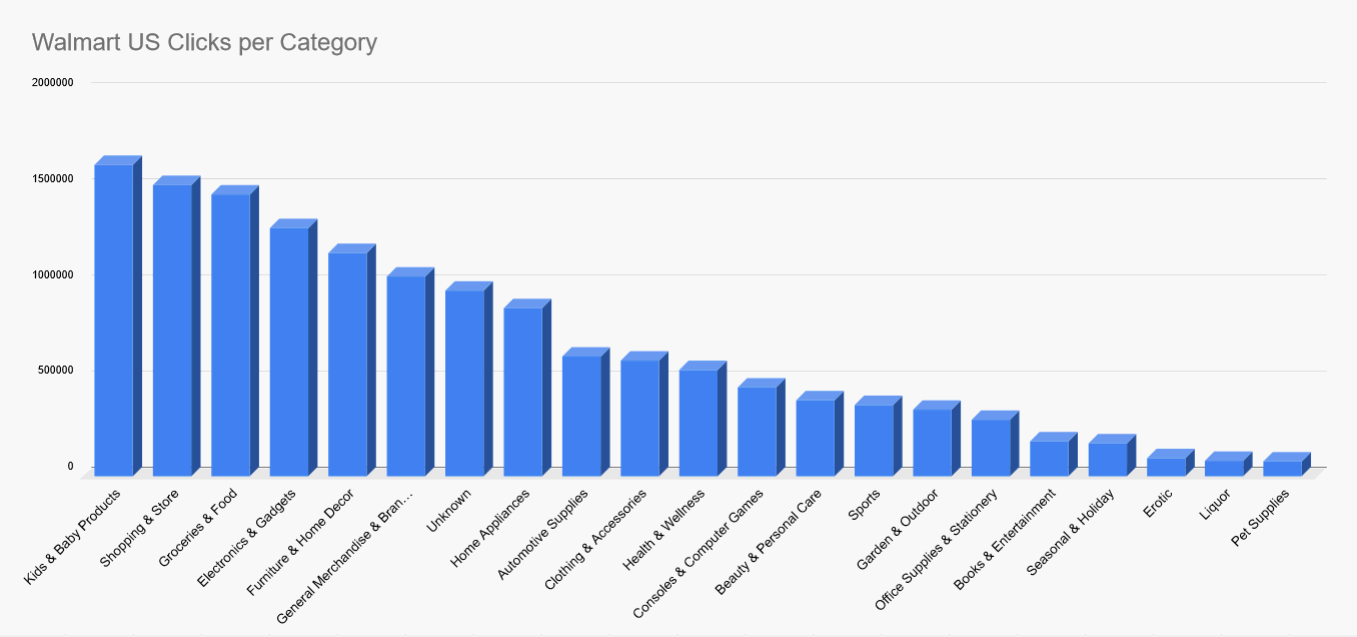
Without Unknown, the following keyword clusters result for Walmart US.
Keyword Cluster Graph Walmart US
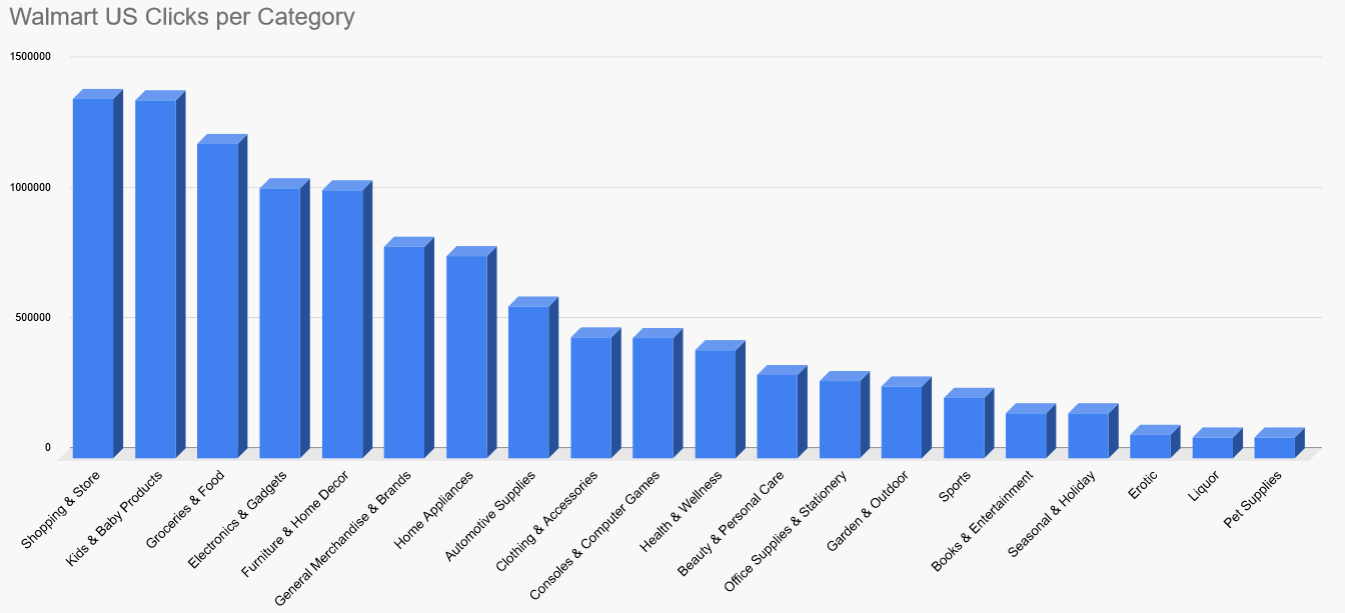
Walmart US Keyword Clustering result cleared of "Unknown"
Partly manually, partly with ChatGPT's "Advanced Data Analysis", I tried to reduce the number of unknowns. The results are not as accurate as before, but they only contain 6.80% percent "Unknown":
Category | Clicks | Percentage (%) |
|---|---|---|
Kids & Baby Products | 1,622,098 | 11.43% |
Shopping & Store | 1,516,207 | 10.68% |
Groceries & Food | 1,465,655 | 10.32% |
Electronics & Gadgets | 1,292,511 | 9.10% |
Furniture & Home Decor | 1,160,497 | 8.17% |
General Merchandise & Brands | 1,039,829 | 7.32% |
Unknown | 965,239 | 6.80% |
Home Appliances | 873,975 | 6.16% |
Automotive Supplies | 624,286 | 4.40% |
Clothing & Accessories | 602,939 | 4.25% |
Health & Wellness | 554,784 | 3.91% |
Consoles & Computer Games | 461,482 | 3.25% |
Beauty & Personal Care | 394,337 | 2.78% |
Sports | 372,710 | 2.63% |
Garden & Outdoor | 347,124 | 2.44% |
Office Supplies & Stationery | 295,977 | 2.08% |
Books & Entertainment | 182,443 | 1.29% |
Seasonal & Holiday | 171,626 | 1.21% |
Erotic | 94,988 | 0.67% |
Liquor | 79,561 | 0.56% |
Pet Supplies | 79,218 | 0.56% |
Walmart US Full Keyword Cluster Graph